
TEAM PROFILE
Hire experienced data visualization professionals to represent your business
Data visualization is the graphical representation of a business’s data and information. It uses technology and tools to create visual stimuli like graphs, charts and maps to communicate data for interpretation purposes effectively.
Data visualization helps businesses identify trends, patterns and anomalies in data from a “big picture” perspective. It is especially useful in businesses when communicating large amounts of technical information to stakeholders that are not data-focused.
The data visualization market is expected to reach USD 19.20 billion by 2027, with a compound annual growth rate (CAGR) of 10.2%1. This growth can be attributed to the rising adoption of visual analytics, information and scientific visualization demands.
To keep up with this anticipated growth, data management companies need to identify ways to hire quality data visualization specialists who are familiar with current visualization tools and have the necessary data interpretation skills, all while keeping employment costs low. A solution; outsourcing.
Many data visualization tasks can be completed digitally, which makes them well-suited to being undertaken in a remote or offshore environment. As long as your business is offshore ready, outsourcing data visualization tasks is cost-effective and straightforward.
From a years’ experience point of view, there are 3 broad levels of 3D designers:
Cost Savings: Your business can outsource repetitive and time-consuming data visualization tasks for a fraction of the price it would cost to hire specialists locally; up to 70% in some cases.
Increase in output efficiency and quality levels: Sending routine data visualization tasks to an offshore team. means your onshore team will have more time, budget and project scope to take on higher-value work. Your business will notice a drastic increase in productivity levels within your data management services.
Business growth and scaling opportunities: When you send your time-consuming tasks to an offshore data visualization team, your local team will have more time to focus on increasing profits, business growth and development opportunities. Your onshore team will have additional capacity as a result of your offshore team’s support, meaning you can grow your business sustainably.
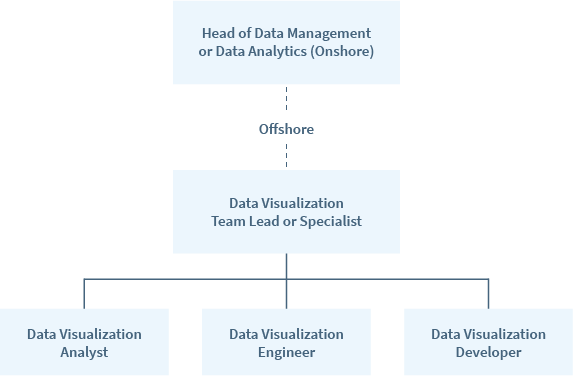
Depending on what outsourced provider you choose to engage, the following roles are well-suited to outsourcing:
Depending on the volume and type of data to be visualized, data visualization teams are typically formed in the following ratios:
It’s important to communicate with your data visualization team exactly what you want them to achieve in each project. An issue that can occur is a lack of communication or alignment of goals. Data visualization focuses on its ability to take large amounts of data and simplify them into understandable terms.
Your outsourced data visualization team needs to understand what audience they are organizing data for; otherwise, you risk oversimplifying data that may miss the key points you originally wanted to express in the graphs and maps.
By spending a little extra time taking your data visualization team through the organizational structure and who they will be creating visuals for will make a significant difference to the efficiencies of your outsourced team.
Reference:
1 Data Visualization Market to Touch USD 19.20 Billion by 2027; Rising Emphasis on Visualization by Businesses and Enterprises to Propel Market Growth: Fortune Business Insights
Most Data Visualization Experts are experienced in the following 3D platforms: